A2L Item 019
- Description: Identify velocity graph for cart on incline
- Goal: Relating physical motion with graphical representation
- Source: UMPERG
- Keywords: Velocity, Mechanics, Graphing, Acceleration
The question for students:
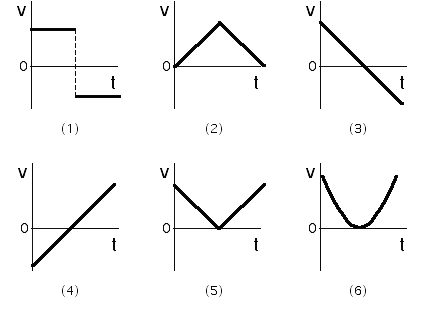
Which of the velocity vs. time plots shown below might represent the velocity of a cart projected up an incline?

Select one of the above or:
(7) None of the above
(8) Cannot be determined
Commentary for teachers:
Answer
(3) or (4). Initially the cart has a non-zero velocity pointing up the incline. The speed of the cart decreases as it moves up the incline, reaching zero at its maximum height. The speed of the cart increases as the cart moves down the incline. The velocity at the bottom of the incline points down the incline. Graph (3)/(4) is correct if up/down the incline is taken as the positive direction.
Background
Students will often associate velocity time graphs with features of the terrain. Many will pick either (5) because they neglect the vector nature of velocity and think about the speed.
Questions to Reveal Student Reasoning
Is the velocity ever zero? Is the velocity ever positive? … negative? When? Is the velocity constant? How do you know?
Suggestions
Plotting the position vs. time may help students come up with the correct plot of velocity vs. time.