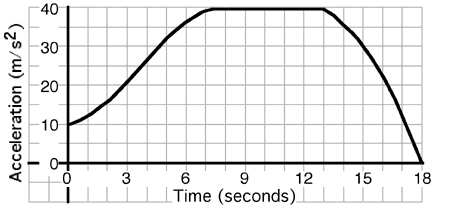
A2L Item 168
- Description: Estimate the average acceleration for a specified time interval from an acceleration/time graph.
- Goal: Interpreting graphs
- Source: CT151.2-5
- Keywords: Acceleration, Graphing, Mechanics
The question for students:
 An
object’s motion is described by the graph above. The average
acceleration during the first 10 s is most nearly…
- 0 m/s2
- 20 m/s2
- 30 m/s2
- 40 m/s2
- 50 m/s2
- Other
Commentary for teachers:
Answer
(3) Students may have difficulty understanding what they are asked. Recasting the problem in terms of areas helps. The only contenders should be #2 or #3. Counting blocks should make it clear that the result is much closer to #3.